
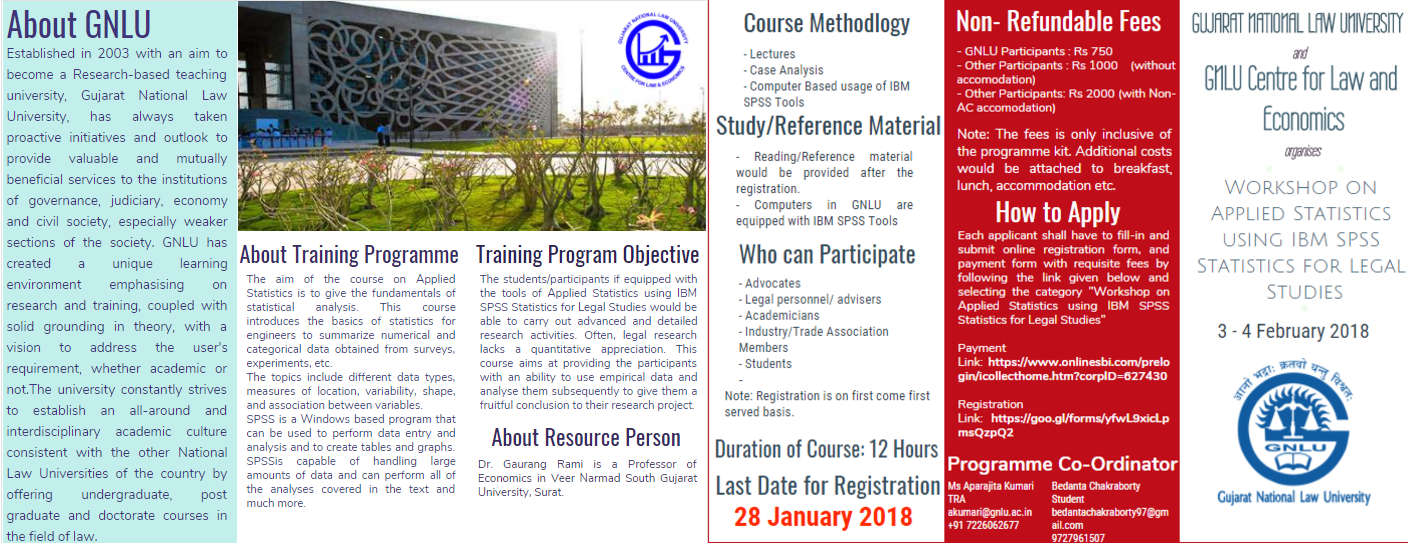
‘Workshop on Applied Statistics using IBM SPSS Statistics for Legal Studies’ on 3-4 February, 2018 under the Center for Law and Economics.
The aim of the workshop on Applied Statistics is to give the fundamentals of statistical analysis. This course introduces the basics of statistics for researchers to summarize numerical and categorical data obtained from surveys, experiments, etc. The topics include different data types, measures of location, variability, shape, and association between variables. The students are expected to learn the fundamental concepts of estimation, confidence intervals, hypothesis testing and apply appropriate tests for population mean, proportion, variance and difference, independence, and goodness to fit.
SPSS is a Windows based program that can be used to perform data entry and analysis and to create tables and graphs. SPSS is capable of handling large amounts of data and can perform all of the analyses covered in the text and much more. SPSS is commonly used in the Social Sciences and in the business world, so familiarity with this program should serve helpful for any empirical research.
Aim of the course
The students/participants if equipped with the tools of Applied Statistics using IBM SPSS Statistics for Legal Studies would be able to carry out advanced and detailed research activities. Often, legal research lacks a quantitative appreciation. This course aims at providing the participants with an ability to use empirical data and analyse them subsequently to give them a fruitful conclusion to their research project.
The course will cover 2 days, 3 – 4 February 2018.
Tentative Course Content: (12 Hours)
- Types of Data and Scale of Measurements
- Questionnaire Preparation and Introduction of IBM SPSS Statistics
- Frequency Distribution and Charts
- Descriptive Statistics, Measures of Central Tendency and Dispersions
- Cross Tabulation with Chi-Square Test
- Multiple Response Analysis
- Correlation Analysis
- Regression Analysis
 492
492